Introduction
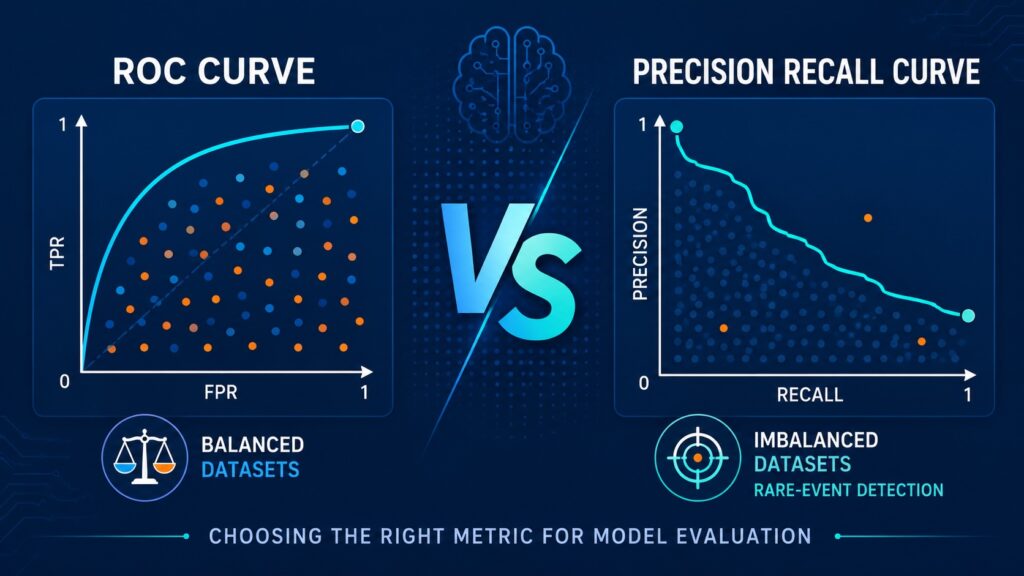
Model refinement is a key ongoing activity, both for newly trained models and during the model’s lifecycle as the corresponding domain evolves. At the core of model refinement is classification evaluation, which assesses model performance and influences refinement decisions. However, different classification evaluation methods have strengths and weaknesses, and selecting the right one is critical to model performance. ROC curve vs precision recall curve are two such methods and are often used together.
Since they are two different metrics of model behavior, it is important to compare them in terms of how each assesses it. It is important to note that each highlights different model behaviors. Often, with each behavior, there is a preference for different domains to which the model is applied. Area Under the Curve (AUC) measures a model’s discrimination ability and is useful for comparing classification models. It is often used with Receiver Operating Characteristic (ROC), which evaluates model performance across thresholds.
However, many real-world domains are not ideal and present imbalanced datasets for model training. AUC, combined with ROC curves, often struggles to evaluate models trained on imbalanced datasets. When datasets are heavily imbalanced, the ROC curves will sometimes hide poor positive-class performance. Hence, when operating in such domains, Precision Recall Curves help to address model evaluation for highly imbalanced datasets vs the ROC curve.
What Is a ROC Curve?
True Positive Rate and False Positive Rate
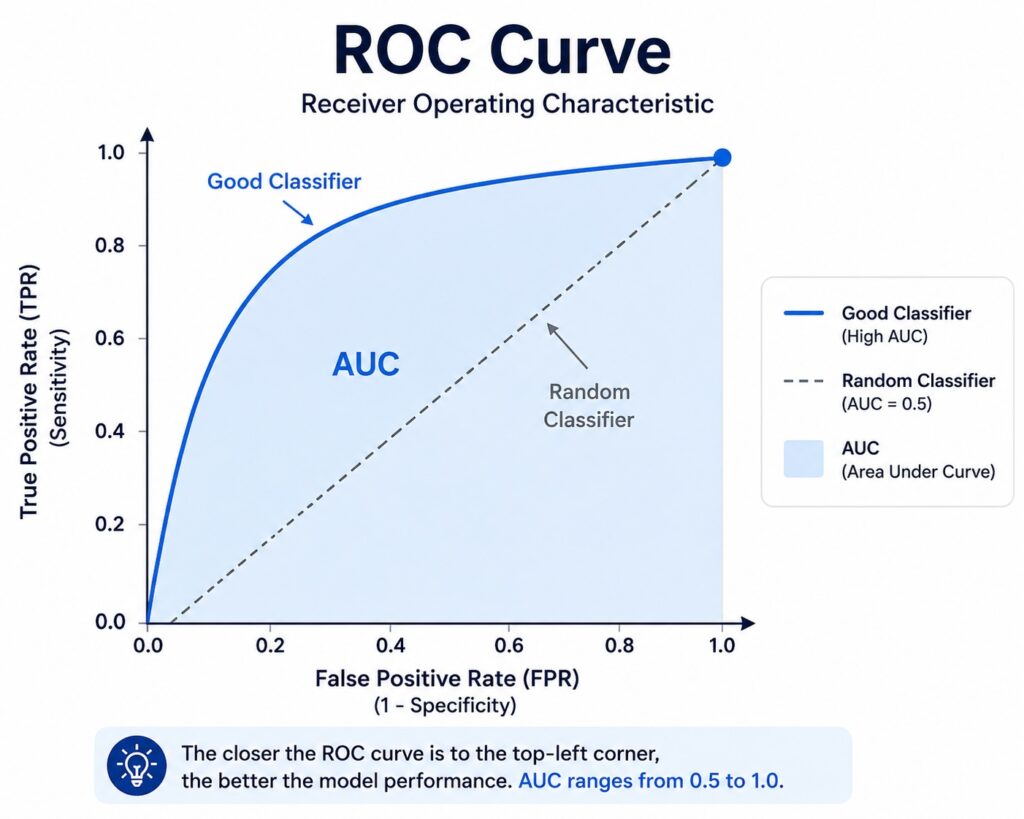
ROC evaluates model performance across thresholds, making it an important measure for refining and tuning models by adjusting thresholds. ROC plots threshold-based classification evaluation curves for the model that show how thresholds change prediction behavior. Specifically, it compares the true positive rate to the false positive rate by plotting their behavior across thresholds.
For a more detailed discussion of ROC metrics and their implementation in machine learning workflows, see the Scikit-learn ROC metrics documentation.
True Positive Rate is the proportion of correctly identified positive cases, which evaluates how many actual positives are correctly predicted. It represents the model’s sensitivity or recall, and its precise formula is:
TPR = TP / (TP + FN)
False Positive Rate is the proportion of incorrectly identified positive cases, which measures the model’s false alarm rate. Its formula is:
FPR = FP / (FP + TN)
Therefore, ROC visualizes the model’s behavior across different decision boundaries.
ROC Curves and Classification Thresholds
The ROC curve shows how the classification threshold affects both TPR and FPR, and the threshold for optimal model performance. It shows how changes in the threshold’s position affect these performance measurements. Typically, lower thresholds yield higher TPR (sensitivity) but also higher FPR (false alarms). However, higher thresholds result in lower false alarms but also lower sensitivity. Hence, the ROC curve illustrates the threshold trade-offs involved in fine-tuning or refining a classification model. Additionally, different combinations of sensitivity and false alarms favor different domains.
ROC AUC and Model Evaluation
However, many other model parameters affect the shape of the ROC curve, and different models may have different curves. Hence, model tuning or selection is based on which model or combination of model parameters yields the optimal ROC curve. The Area Under the Curve (AUC) allows comparison of different ROC curves to determine which one is optimal. Higher AUC indicates stronger classification performance, and a value near 1.0 indicates excellent discrimination. Lower AUC indicates weaker separation capability, with a value near 0.5 indicating random guessing. However, ROC AUC performs best on balanced datasets but does not always indicate strong positive-class performance on imbalanced ones.
What Is a Precision Recall Curve?
Precision and Recall Explained
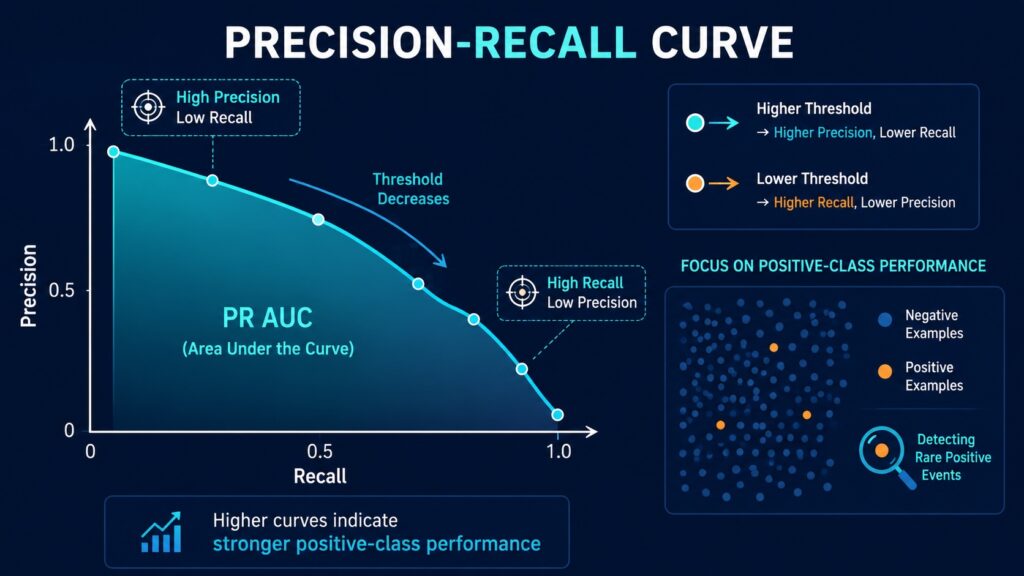
The precision recall curve is another model performance measure besides the ROC curve, and it shows the precision vs recall across thresholds. Precision measures the proportion of reported cases that are actually correct and indirectly indicates the level of false alarms. It is the number of reported positives that are correct over the total number of reported positives, whether correct or incorrect. Its formula is expressed as
Precision = TP / (TP + FP)
This is strongly related to the Positive Prediction Quality, which measures the accuracy of positive predictions. A simple real-world scenario is how well a spam filter correctly identifies spam email.
Recall measures the number of positives that the model actually reports and indicates the sensitivity of the model. Its formula is expressed as
Recall = TP / (TP + FN)
This is closely related to Positive Prediction Capability, the ability to identify actual positive cases. Medical screening that correctly detects disease cases is an important example with life-or-death consequences.
For additional details on precision, recall, and precision-recall evaluation metrics, see the Scikit-learn Precision-Recall metrics documentation.
Precision Recall Curves and Threshold Trade-Offs
The precision recall curve shows how precision and recall change as the threshold is adjusted during model tuning. Lower threshold typically increases recall and model sensitivity to identify more positives, but lowers precision, resulting in far greater false alarms. Increasing the threshold typically increases the precision, with a lower number of false alarms, but reduces recall, resulting in more missed positives. The curve shows precision vs recall trade-offs, where different thresholds result in different precision vs recall trade-offs. Different domains favor different trade-offs depending on whether the priority is reducing missed positives or reducing the number of false alarms.
Precision Recall Curves and Positive-Class Performance
Precision recall curves focus on the positive class. This is because both formulas compare true positives to the total actual positives and the total reported positives. This is an advantage when the domain has a significant imbalance of relatively few positive cases. Therefore, models are trained on heavily imbalanced datasets, with positive cases constituting a very small fraction of the population. Precision recall, with its emphasis on positive cases, can assess models for rare-event classification. Examples include fraud detection and medical diagnosis.
Key Differences Between ROC Curve vs Precision Recall Curve
ROC Curve vs Precision Recall Curve Comparison
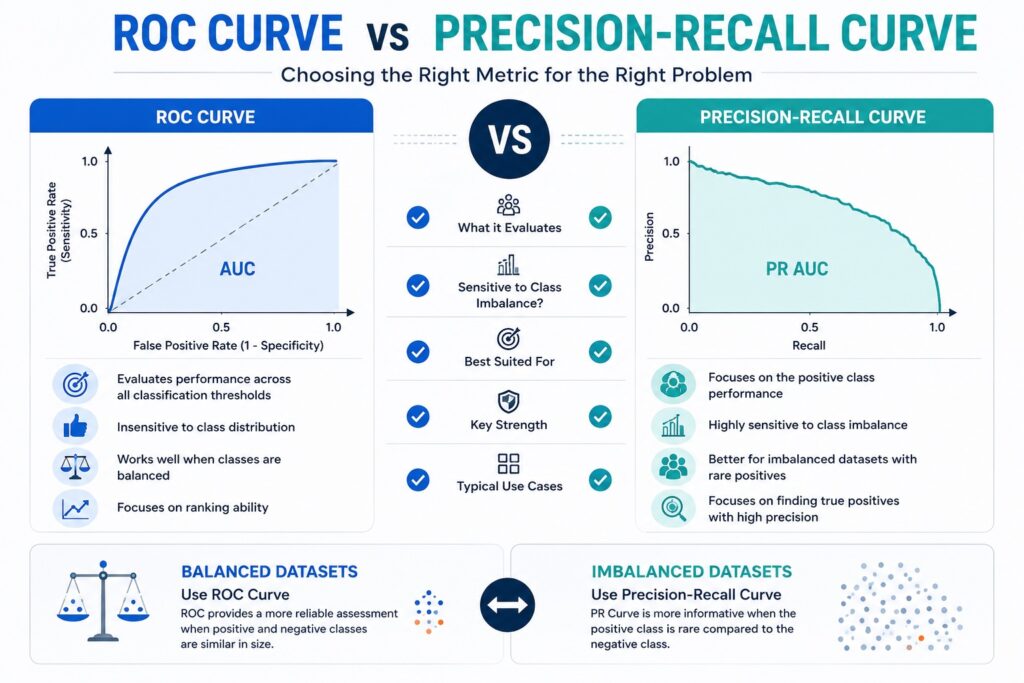
Both the ROC Curves and the Precision Recall curves evaluate model performance. Critically, they highlight the trade-offs between sensitivity and rate of false alarms. They both analyze how changing the model threshold changes the balance between sensitivity and false alarm rate. However, they differ in the focus of evaluating the model. ROC evaluates True Positives against False Positives in finding the optimal threshold. However, PR evaluates precision versus recall, with True Positive being in both formulas. These metrics affect the model’s sensitivity to balanced and imbalanced datasets.
Sensitivity to Class Imbalance
Different domains have different balances between positive and negative cases, with some domains highly skewed toward negative cases. ROC is better with balanced datasets that contain similar positive and negative class sizes. This is because ROC evaluates both positive and negative class behavior, making classifier separation easier to interpret. However, imbalanced datasets can artificially suppress false positive rates, causing the ROC to hide missed positive cases. But since Precision Recall curves focus on positive-class behavior, they emphasize false positives and false negatives. This makes missed positive cases more visible and false-alarm behavior clearer. Fraud detection is an example of a highly imbalanced dataset, where fraud is typically a rare event. Here, Precision Recall curves help minimize missed fraud events. Similarly, medical diagnoses rely on strong recall evaluation, given the small size of actual cases compared to the rest of the population.
Interpretability and Positive-Class Evaluation
The domain that ML models are applied to is an important factor when selecting model evaluation metrics for refining and tuning models. ROC curves evaluate the overall model (or classifier) separation and interpret false positive rates across thresholds. Precision Recall curves emphasize positive-class behavior and interpret positive prediction quality and sensitivity. Both curves plot how threshold selection affects false-positive and false-negative behavior. Lower thresholds increase sensitivity but increase false alarms, but higher thresholds reduce false alarms but increase missed positives. Different domains prioritize different trade-offs between sensitivity and false alarms, which influences threshold selection. Also, different domains have different compositions of positive and false cases, which influences the choice between ROC and Precision-Recall curves.
Why ROC Curves Can Mislead on Imbalanced Datasets
Imbalanced Datasets and ROC Limitations
Prediction models are applied to many domains that are heavily skewed and have a small positive-class population. The negative cases far outnumber the positive cases, and this is reflected in the datasets used to train these models. Fraud detection is one such example that commonly produces highly imbalanced datasets, in which anomaly detection involves rare positive events. Another is medical diagnoses that often contain relatively few actual disease cases. Such datasets result in large true-negative counts that dominate evaluation metrics, causing false-positive rates to appear artificially low. This makes ROC curves appear stronger than actual positive-case performance and hides missed positive cases during ROC evaluation. Therefore, ROC curves often produce misleading evaluation results due to imbalance, which are used to tune models.
Fraud Detection and Medical Screening Examples
This has implications for certain domains that carry far-reaching consequences, such as fraud detection and medical screening. In fraud detection, legitimate transactions far outnumber fraud cases, and anomaly detection systems monitor rare abnormal events. However, missed fraud cases can result in significant financial loss. Medical diagnoses generally involve few actual disease cases, but missed diagnoses can lead to life-threatening consequences. Another example is cybersecurity intrusions, which are often small in number but can have catastrophic consequences. In each of these scenarios, false positives increase operational risk, making positive-case sensitivity critically important. Therefore, high recall helps reduce missed positive cases, which means that precision recall curves improve rare-event evaluation. Inference engines operating in imbalanced domains require strong positive-case detection, highlighting the importance of recall evaluation.
Why Precision Recall Curves Perform Better
The metrics used for precision recall curves are more strongly focused on positive-class behavior and reduce the impact of large negative populations. Hence, PR curves more clearly reveal precision degradation. They make false positives easier to identify and false negatives more visible during evaluation. PR curves also emphasize sensitivity to rare positive events, reducing the use of erroneous data for tuning and refining models. Therefore, PR evaluation is often applied to fraud detection systems, and medical diagnoses often prioritize recall sensitivity. PR curves provide strong imbalance evaluation, making positive-case weaknesses easier to detect. This makes threshold trade-offs clearer for imbalanced datasets, allowing practical model evaluation based on domain priorities.
ROC Curve vs Precision Recall Curve: When to Use Precision Recall Curves Instead
Rare-Event Classification and Imbalanced Datasets
Many domains have a very small number of positive cases compared to the rest of the population. Models applied to these domains must correctly classify these rare events when they occur. Models that handle these heavily imbalanced datasets must have sensitivity to positive cases. However, ROC assigns equal weight to positive and negative cases, leading models to miss positive cases. PRs place a greater weighting on positive cases, making models more sensitive to them and less likely to miss them. This makes models more capable of detecting anomalies and reduces the risk of missing positive cases.
Fraud Detection and Cybersecurity Alerts
Different domains with imbalanced populations still have different priorities on recall versus false alarms. Two domains that place priority on recall are fraud detection systems and cybersecurity intrusion detection. Both have very low occurrences of anomalies, but need to detect them when they do occur, either fraud or security breaches. There are serious consequences of false negatives, since they can represent fraud resulting in financial loss or damage from security breaches. Hence, there is an emphasis on recall to mitigate operational risk, with lower thresholds prioritized when tuning models.
Spam Filtering and Practical Model Tuning
In many scenarios, spam is not as rare as fraudulent cases in security breaches. However, it remains sufficiently underrepresented to warrant precision-recall curves. Another contrast is that spam mail detectors prioritize reducing false alarms, since false alarms can cause user irritation. Therefore, model threshold tuning would shift toward higher thresholds, reducing false alarms even though more positive cases are missed.
ROC Curve vs Precision Recall Curve: ROC AUC vs PR AUC Explained
What ROC AUC Measures
The ROC AUC is the area under the ROC curve, and it measures the overall discriminative ability of a classifier. I.e., how well a model separates classes. It assesses a model’s ranking quality, i.e., how well the model places positive cases above negative cases when assigning prediction scores. A higher ROC AUC indicates stronger class separation, while a lower ROC AUC indicates weaker class separation. This also evaluates models independent of threshold, allowing comparison between classification models. However, ROC AUC is most effective when positive and negative classes are more evenly represented.
What PR AUC Measures
The PR AUC is the area under the Precision Recall curve and measures the overall positive-class performance. Therefore, it evaluates how precision and recall change as classification thresholds are adjusted. It evaluates how often predicted positive cases are actually positive, indicating how effectively a model identifies actual positive cases. The PR AUC also shows the trade-offs between precision and recall by emphasizing the performance on positive cases. The key benefit is that it reduces the influence of large negative populations in rare-event classification. It enables model comparison since a higher PR AUC indicates strong positive-class performance across thresholds.
ROC AUC vs PR AUC on Imbalanced Datasets
Since many domains are highly skewed, it is important to assess model evaluation techniques across balanced and imbalanced domains. Dataset composition affects the effectiveness of different evaluation methods, requiring careful investigation of these methods. ROC AUC often appears overly optimistic on imbalanced datasets, where large true-negative populations can inflate a model’s ROC AUC performance. However, PR AUC is more sensitive to positive-class error, making false positives and false negatives more visible. Significantly, PR AUC provides stronger insight into rare-event classification performance. Therefore, ROC AUC and PR AUC can produce different conclusions on the same dataset.
Real-World ML Examples
Fraud Detection
Fraud detection is an important example of an imbalanced real-world domain where fraudulent transactions represent a small fraction of all transactions. False negatives are consequential because missed fraud cases result in financial loss and allow fraudulent activity to continue undetected. Therefore, fraud detection places a high priority on positive-case detection, making recall a critical evaluation metric. Models with higher recall reduce missed fraud cases, and their threshold tuning favors positive detection with lower thresholds, improving fraud detection sensitivity. This makes precision recall curves better suited to evaluating fraud-detection classifiers, since they emphasize positive-class performance. Additionally, priority is given to minimizing missed fraud cases rather than reducing false alarms.
Medical Screening
Medical screening is another important domain with imbalanced populations whose impact can have life or death consequences. Disease cases often represent a small proportion of the population, resulting in frequently imbalanced datasets for medical screening classifiers. Missed diagnoses can have life-threatening consequences, whereas early disease detection improves treatment outcomes. This makes positive-class detection a critical objective since false negatives often increase patient risk. This means that higher recall reduces missed disease cases, making recall sensitivity an important evaluation metric. Applying precision recall curves to medical screening models provides a strong evaluation of positive-class performance on imbalanced datasets. Again, the priority is to maximize the detection of missed disease cases rather than to reduce false alarms.
Spam Classification
While not as consequential as fraud detection or medical screening, spam detection is another domain that often has an imbalanced population. Spam classification identifies unwanted email messages. However, unlike fraud detection or medical screening, it places equal priority on both precision and recall. This is because false positives can incorrectly block legitimate emails. These blocked legitimate emails are false alarms that negatively affect user experience. This makes precision an important evaluation metric, and higher precision reduces the number of legitimate emails that are blocked. Therefore, higher thresholds are selected for spam detectors since they typically reduce false alarms and the number of blocked legitimate emails.
Best Practices for Evaluating Classification Models
It is clear from the rich diversity of domains and use cases that there is no one single universal metric for evaluating classification models. Different domains have different compositions of positive and negative cases that favor one metric over another. Different use cases have different priorities that also favor one metric over another. ROC metrics typically favor domains with balanced populations of positive and negative cases. In contrast, PR favors domains with a very small number of positive cases to negative cases. Additionally, AUC also indicates classification performance and is used to compare models.
The Importance of the Confusion Matrix
The confusion matrix provides the principal evaluation metrics for classification models, and additional metrics can be derived from these metrics. It consists of four metrics, true positives representing correctly identified positive cases, and false positives representing false alarms. It also includes false negatives, representing missed positive cases, and true negatives, representing correctly identified negative cases. Both precision and recall are derived from the values. Furthermore, metrics associated with ROC and PR derive from confusion matrix values. Confusion matrices also provide deeper insight than individual metrics alone.
Evaluation metrics show how well a classification model performs, but they do not explain which input variables are driving its predictions. Feature importance in machine learning provides this complementary perspective by identifying the features that have the greatest influence on model behavior. Ultimately, it is the business domains and use case priorities that decide classification model design, training, and tuning. Therefore, evaluation metrics should support business objectives and the domains in which they operate. Select the ROC curve for business domains that have balanced populations of positive and negative cases. For business domains with a very small representation of positive cases, then select the PR curve. Perform threshold tuning that reflects operational consequences and aligns with business domain priorities.
Final Thoughts
ROC curve vs precision recall curve are two widely applied methods in classifier model evaluation. They provide different perspectives on model behavior, where each is suited to certain classes of business domains. ROC curves perform well on domains that are associated with balanced datasets. In contrast, PR curves perform well on domains associated with imbalanced datasets. Therefore, there is no universal metric that fits every domain, but domain context determines metric selection.
It follows that model evaluation is context-dependent, and different models are tuned to the particular business domain to which they are applied. Therefore, when tuning these models, business objectives influence metric selection used to evaluate these models for refinement. Additionally, threshold tuning affects outcomes, and different business priorities match certain outcomes over others. Hence, optimal thresholds must be selected according to business priorities and desired outcomes.
Further Learning
Affiliate Disclosure
As an Amazon Associate, AI Cloud Data Pulse earns from qualifying purchases. If you purchase a product through one of the links below, we may receive a small commission at no additional cost to you. We only recommend books and resources that are relevant to the topics discussed in this article and may provide value to our readers.
Hands-On Machine Learning with Scikit-Learn, Keras, and TensorFlow: Concepts, Tools, and Techniques to Build Intelligent Systems by Aurélien Géron
This book provides hands-on machine learning examples using Scikit-learn and TensorFlow, including classification metrics, ROC curves, precision-recall analysis, and model evaluation techniques.
Introduction to Machine Learning with Python: A Guide for Data Scientists by Andreas C. Müller
This practical introduction to machine learning with Python covers classification evaluation, ROC curves, precision-recall metrics, model tuning, and real-world Scikit-learn workflows.
If you would like hands-on practice with classification metrics, model evaluation, and machine learning workflows, Pluralsight offers a range of machine learning and data science courses that cover ROC curves, precision-recall analysis, confusion matrices, and model tuning.
References
An Introduction to ROC Analysis (Fawcett, 2006)
The Relationship Between Precision-Recall and ROC Curves (2006)